Everything about a property in one place
Transaction prices from notarial deeds, the local plan, risks, utilities, sun exposure and an AVM valuation. Below are real screenshots — not mockups.
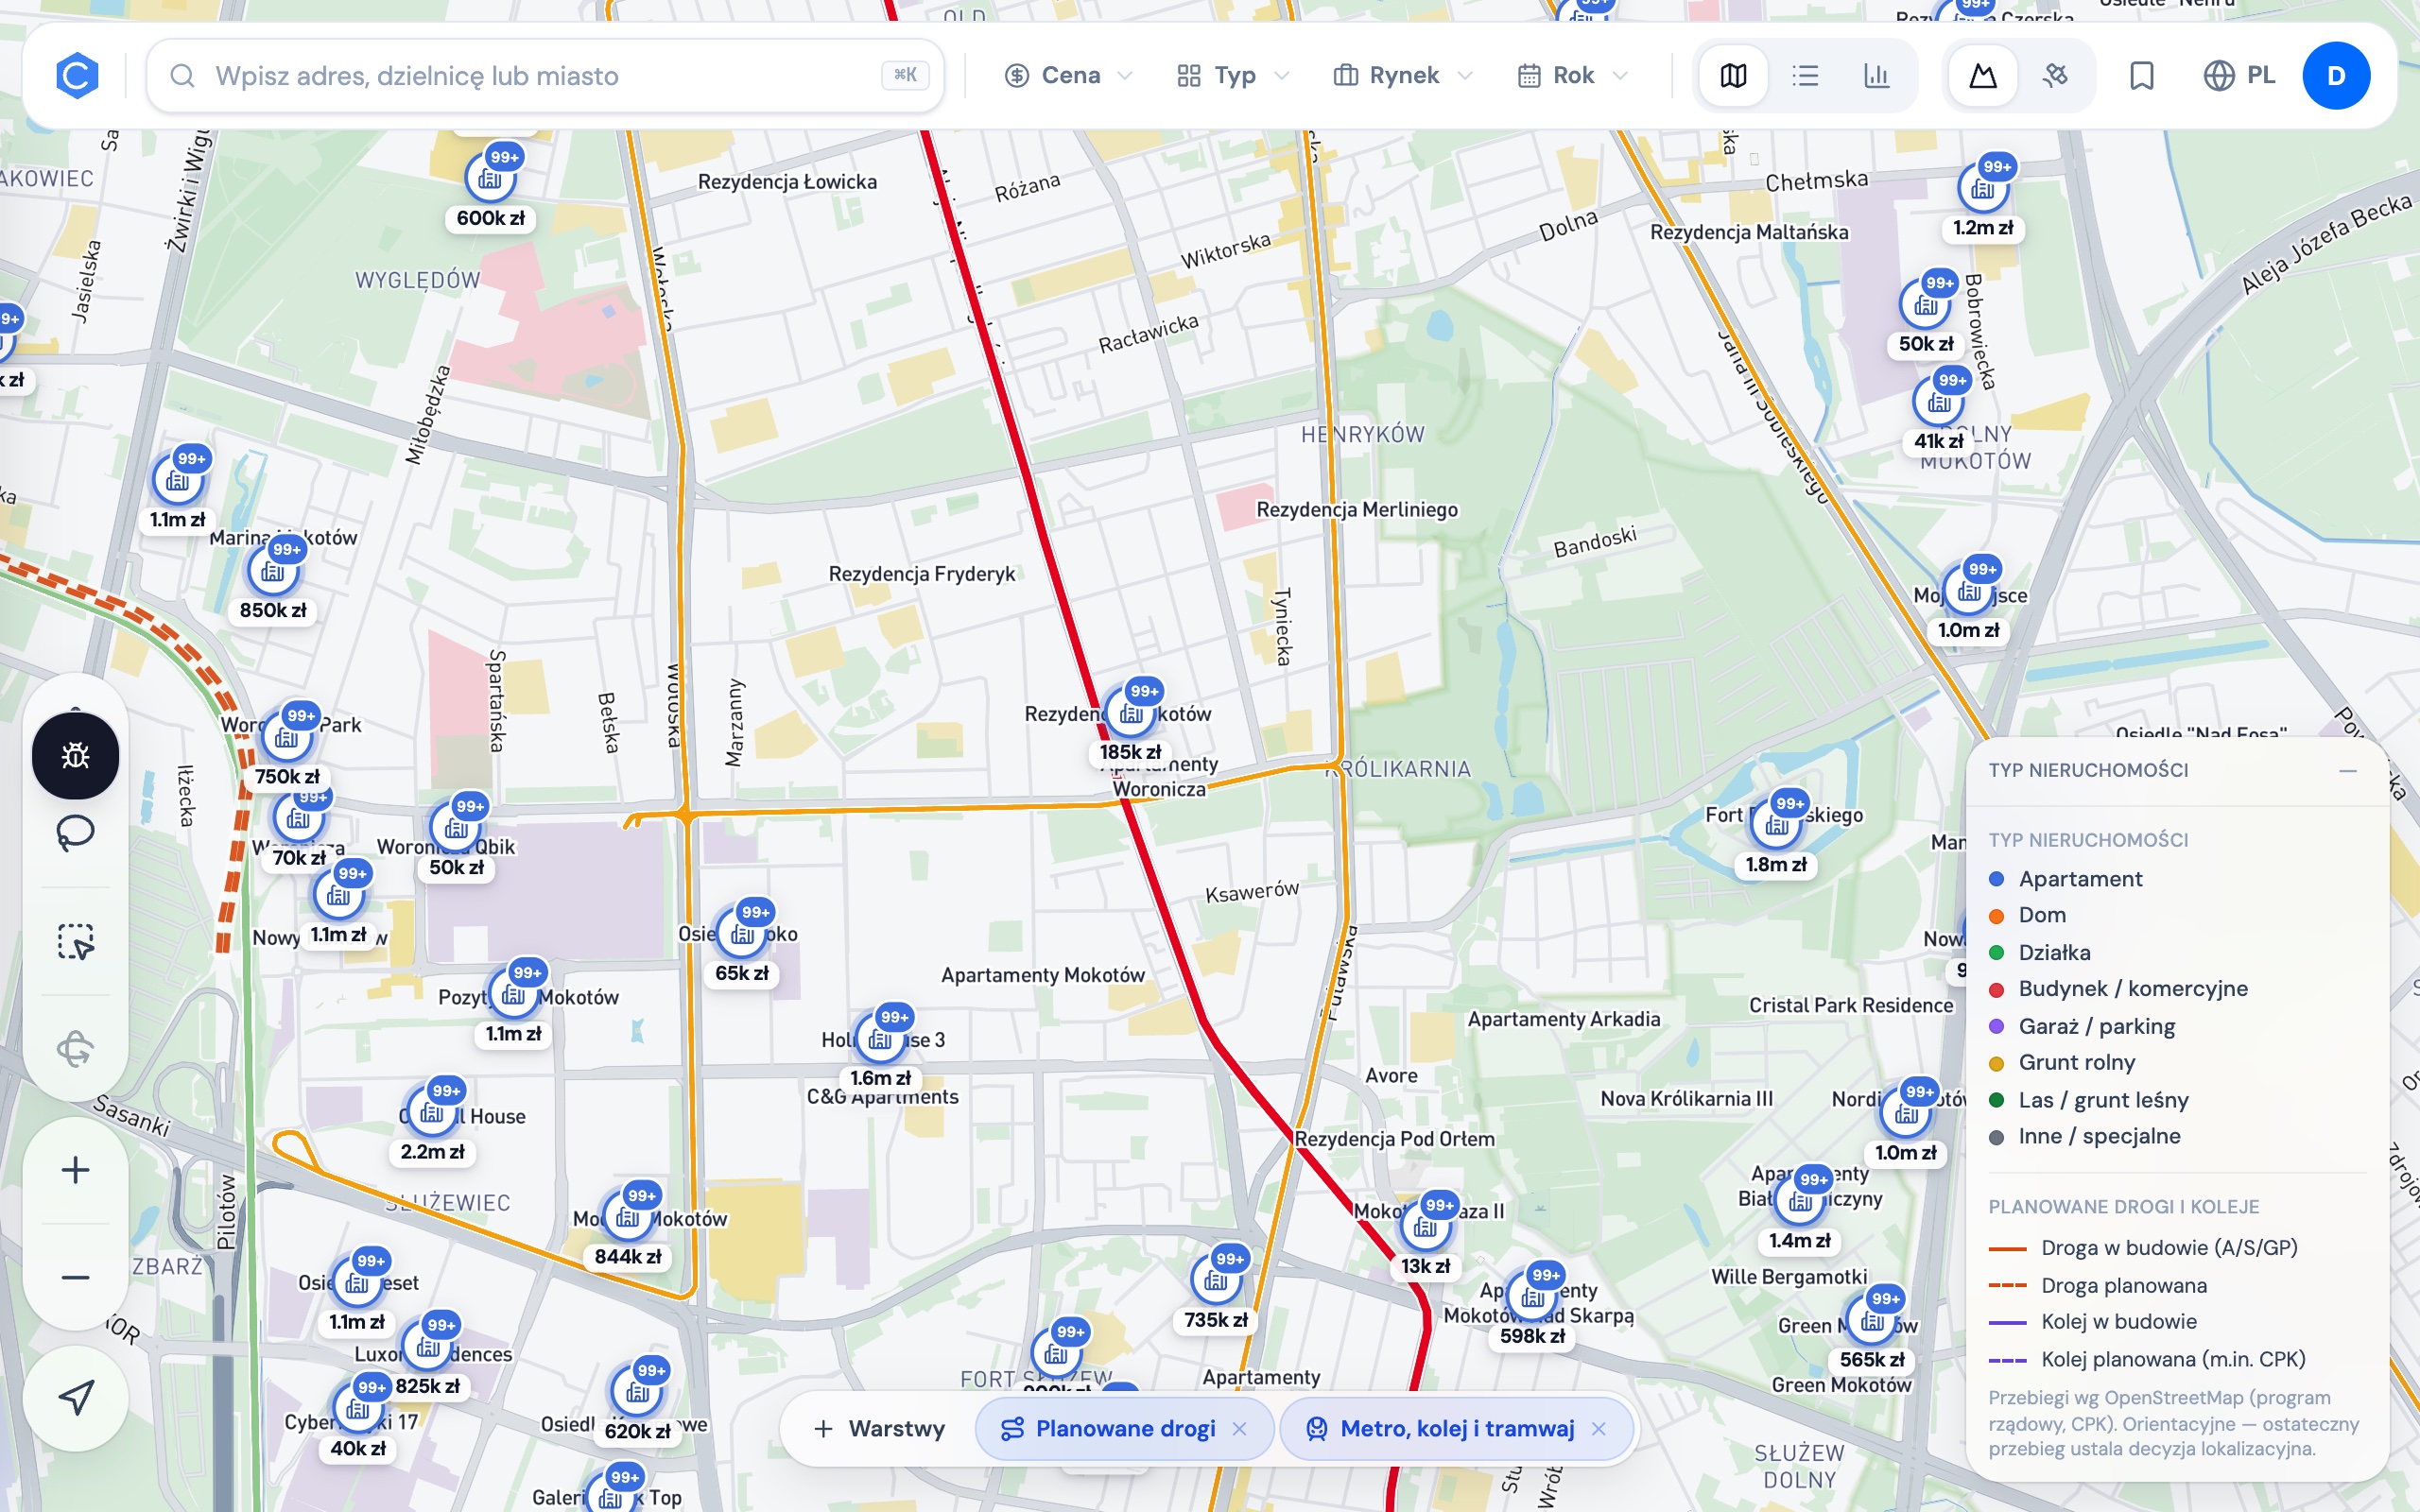
Transaction prices, not listings
Every marker is a signed notarial deed — price, area, date. Filter by type, primary vs secondary market, price and size; click a point for the deal's details.
- 8 property types, each in its own colour
- Primary and secondary market separated
- Building, estate and region clustering
43 due-diligence topics for one parcel
Land registry, the local plan and its parameters, the general-plan zone, flooding, nature and heritage protection, utilities, road access, neighbourhood and an AVM valuation — one document, every figure sourced. Where data doesn't exist, the report says so.
- 6 chapters, 43 topics, PDF in Polish and English
- CAD/GIS export: DXF, GeoJSON, KML, XLSX
- Every number carries its source
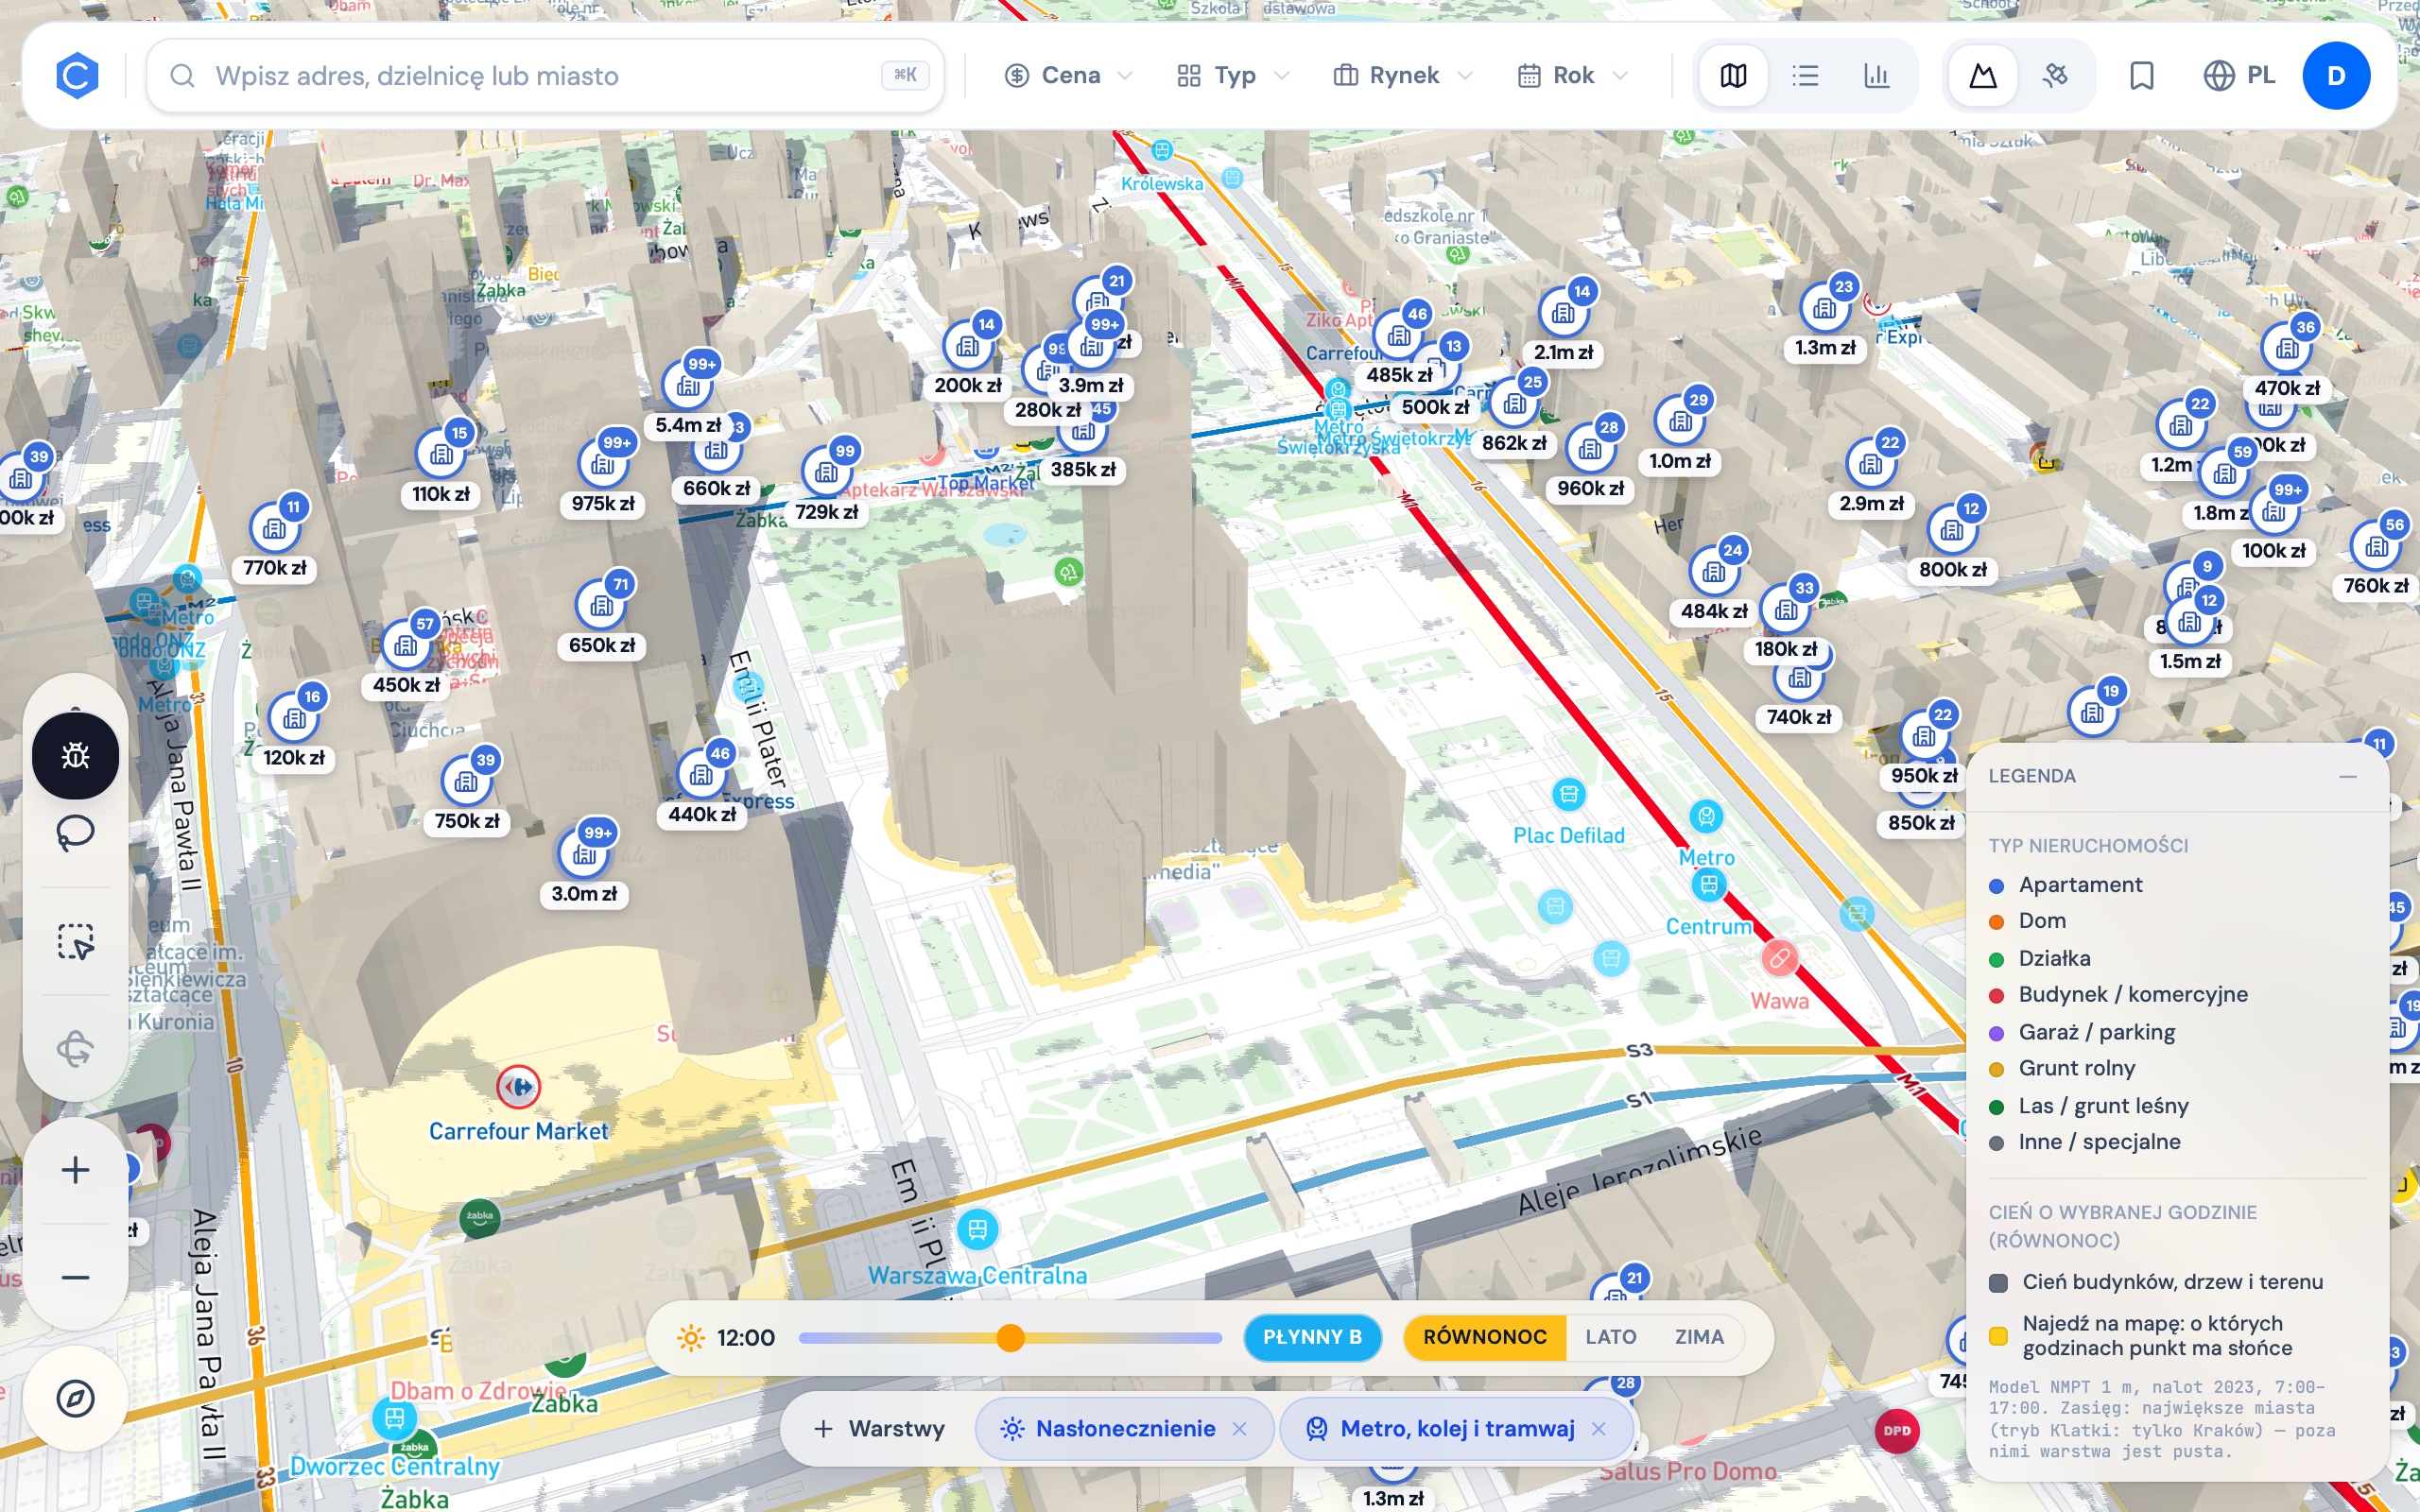
How much sun this plot gets — hour by hour
Shadows of buildings, trees and terrain computed from the national elevation model (1 m LiDAR). Drag the hour slider, switch season, hover any point — the map gives you the hours it sees sun.
- NMPT 1 m model, 2023 survey
- Equinox, summer and winter
- Poland's largest cities
What's worth building here
Maximum envelope from the plan's parameters, automatic parking layout on the real parcel outline, a residual land value model and a monthly cash flow — with a sell-down curve measured from actual handover data.
- Buildable footprint and 3D massing from plan parameters
- Parking compliant with §19 of the technical conditions
- RLV, scenarios and monthly cash flow
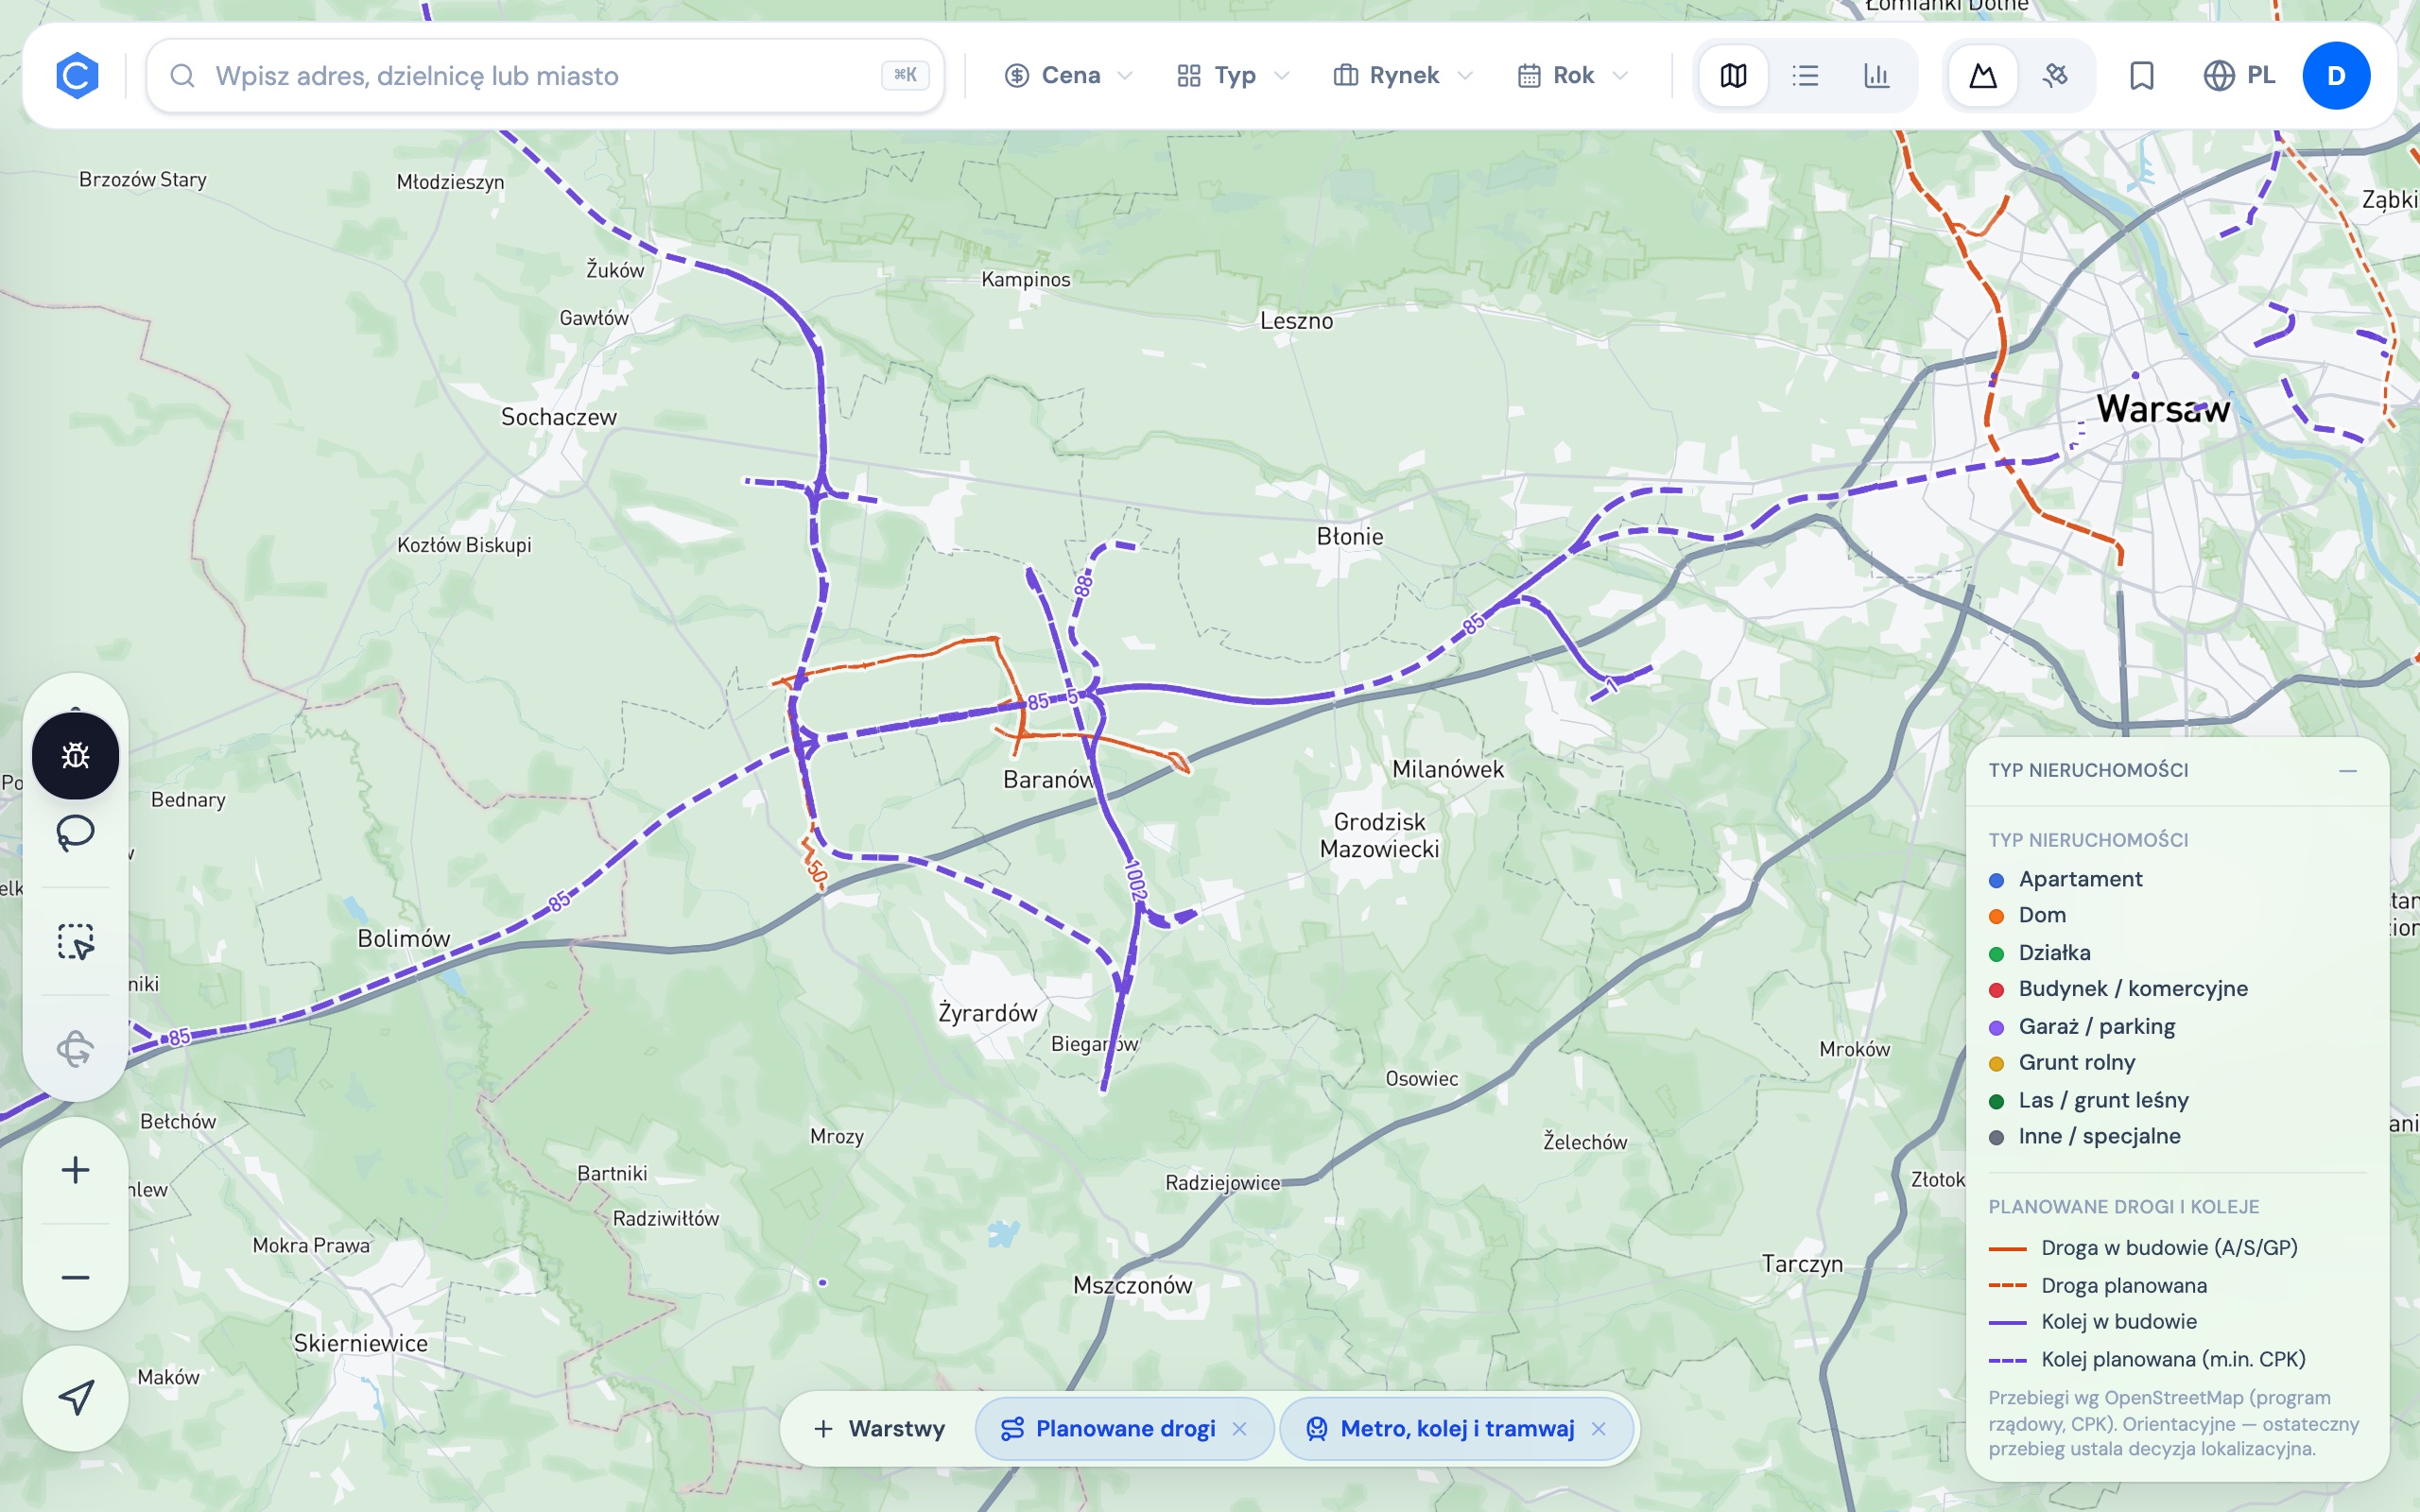
What hasn't been built yet
Planned and under-construction roads and railways (including CPK), the power grid, noise, nuisances, schools, fibre internet, mineral deposits and landslides — a dozen-plus layers, each one click away.
- Planned roads and rail from government programmes
- Travel-time (isochrone) filter
- Historical aerial imagery and GUGiK orthophoto
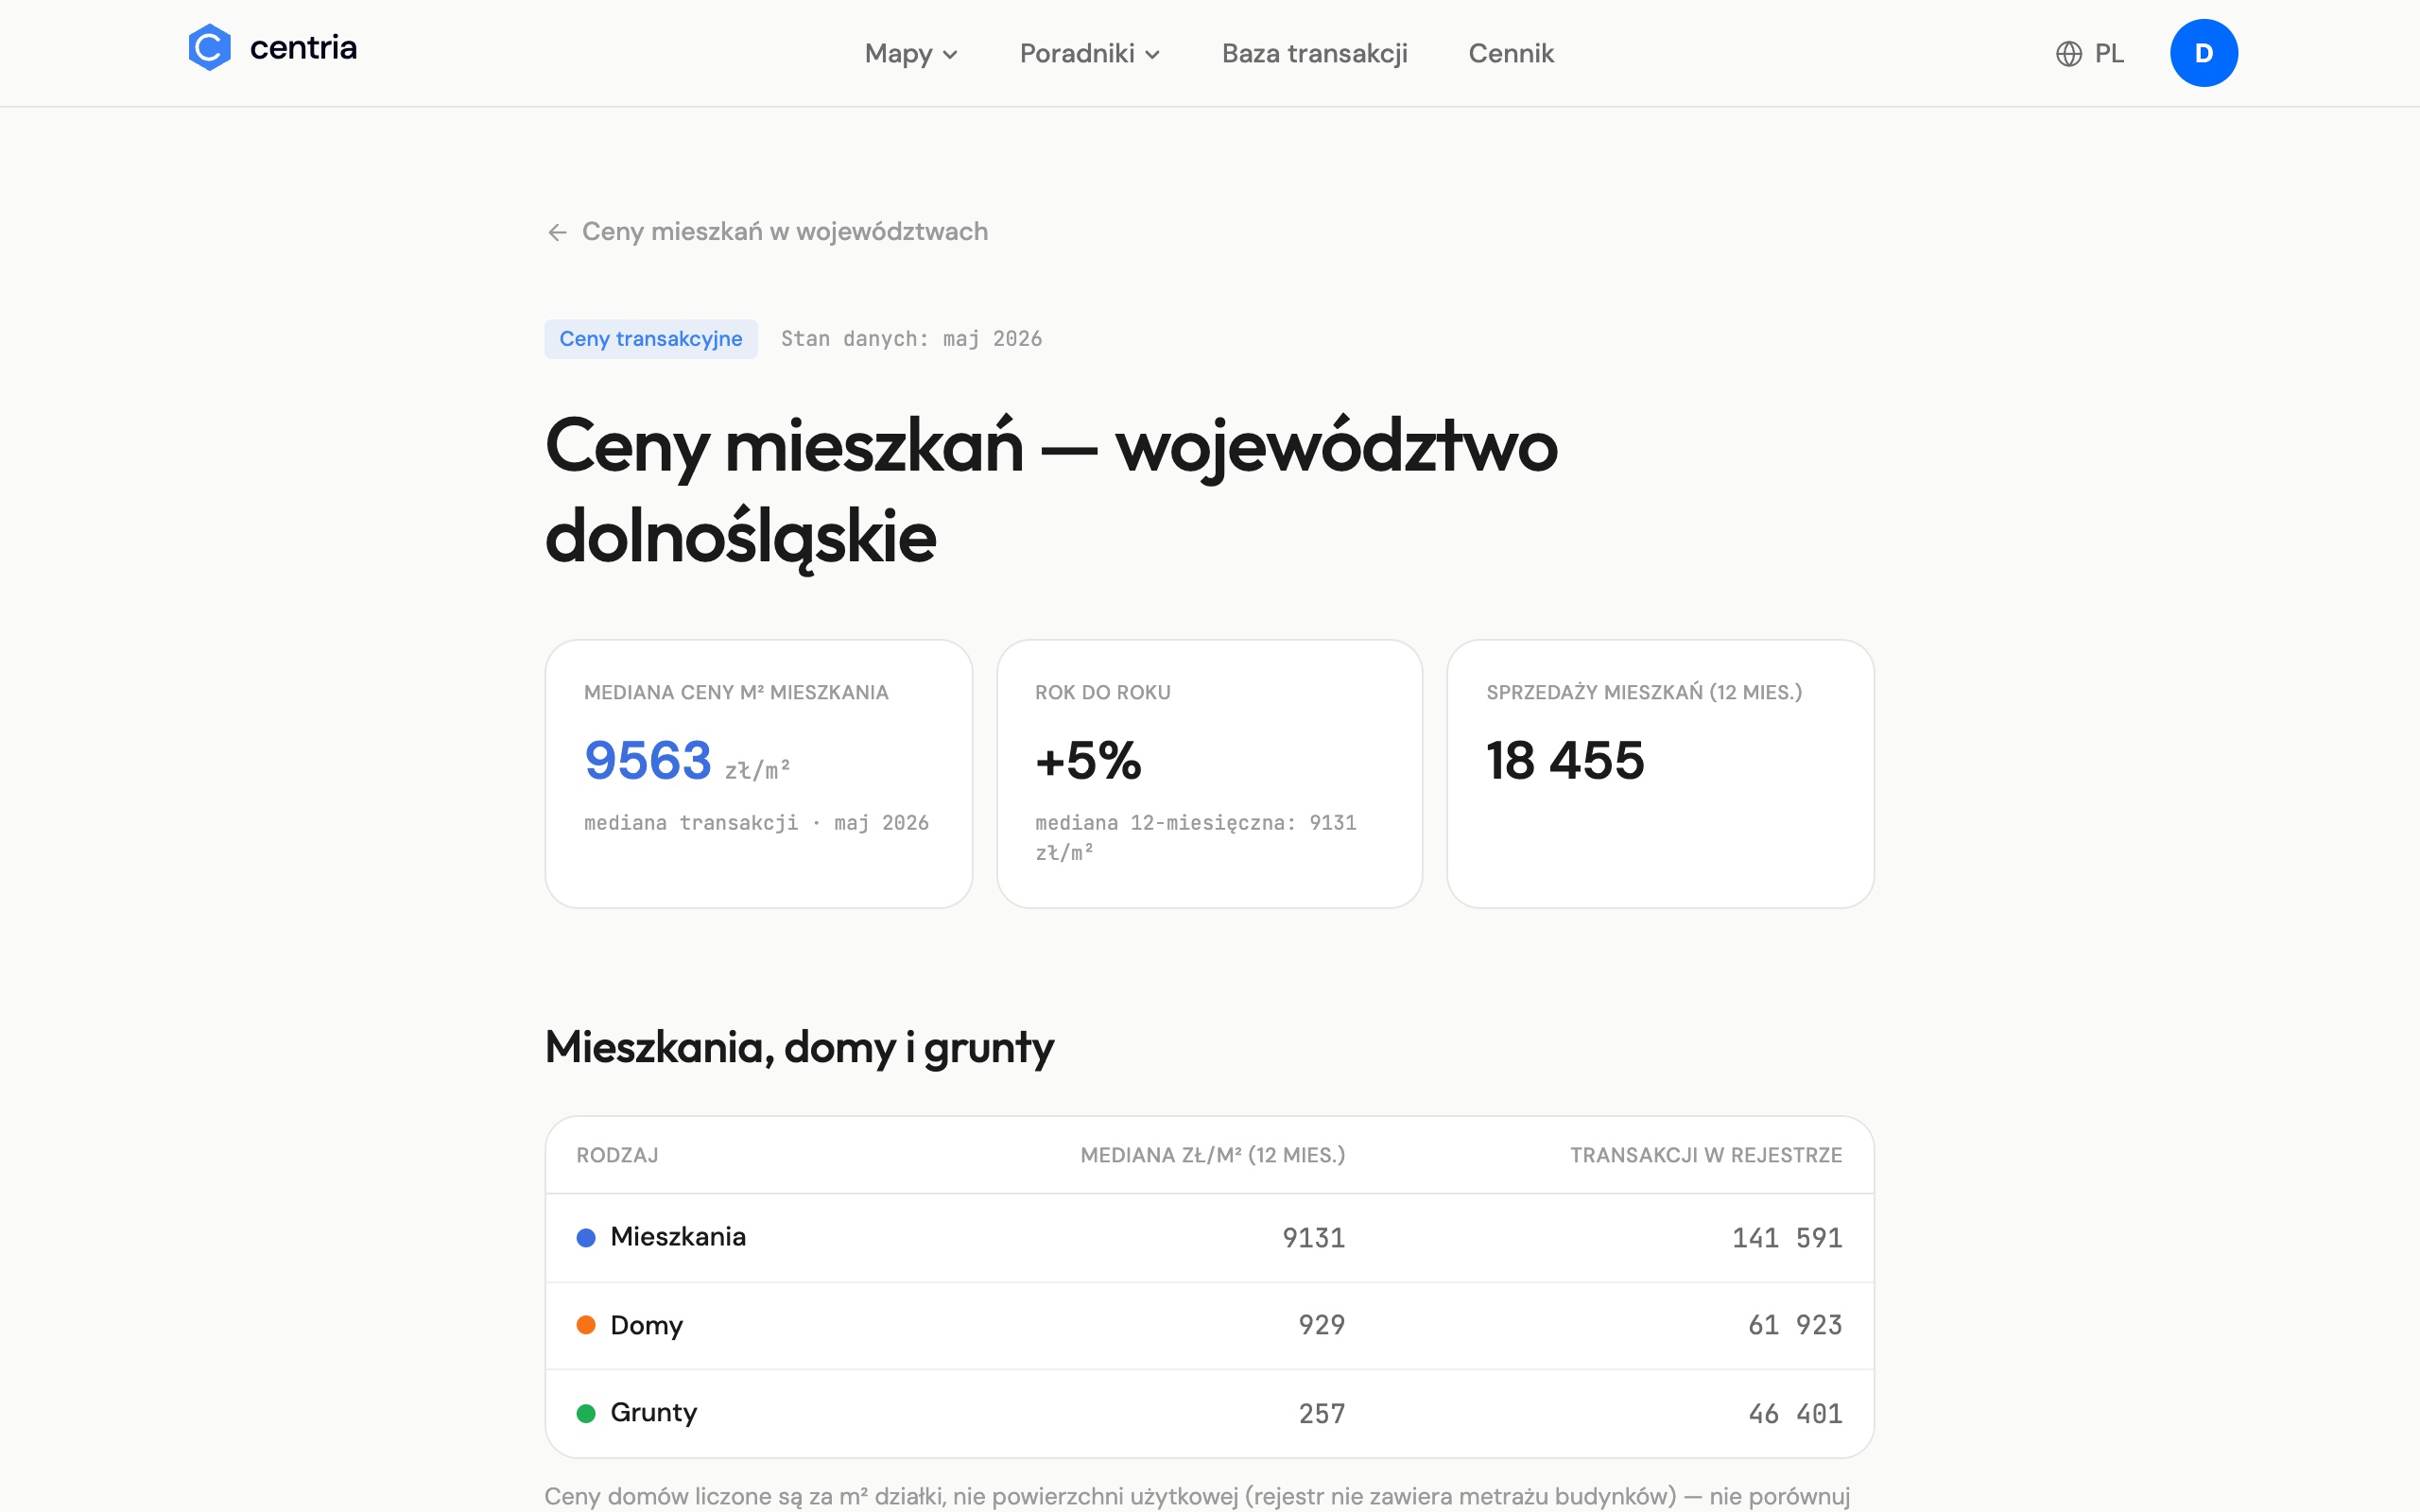
Prices in your region, recomputed daily
Median prices per m² for every voivodeship, county and gmina — monthly trend, primary/secondary split and a ranking of the priciest areas. All from the same RCN registry.
- 16 voivodeships, 162 counties, 309 gminas
- Monthly trend up to the last complete month
- Ranking of the priciest counties and gminas
A valuation model trained separately for apartments, houses, plots, farmland and garages — with a range, not a single number pretending to be certain.
The full deal table with filters and export — the same source that feeds the map and the statistics.
The general plan, MPZP, the urban register and farmland conversion, explained well enough to act on.
Parcel boundaries and layers as DXF, GeoJSON and KML — ready to drop into a project.
Check a specific parcel
Type an address or click a parcel on the map — we'll collect the rest from the registries and put it in one report.